
Monitoring, Debugging, and Scaling Aptos DApps with Sentio
So, you're building on Aptos? Smart move. As the ecosystem grows, developers need solid tools to monitor, debug, and scale their DApps. Sentio provides exactly that.
This guide breaks down how Sentio supports your entire Aptos development workflow, from initial data collection to production monitoring.
What Makes Aptos Special
Aptos has a lot going for it. Built from Meta's Diem project, it's designed around the Move programming language with its resource-based model that makes asset management safer by design, making it naturally harder to create bugs like re-entrancy or double-spends. The parallel execution engine (Block-STM) processes transactions concurrently, meaning your DApp can handle more users without slowing down.
These features make Aptos a great choice for complex DeFi protocols and high-throughput applications. However, every blockchain project needs the right tools to get the job done.
Whether you are debugging transaction failures for a high-throughput application, tracking TVL for a DeFi protocol, analyzing user retention for an NFT marketplace, or auditing contract interactions as a security researcher, this guide provides the tools you need.
The Complete Sentio Platform for Aptos
We've built Sentio to take the infrastructure headaches off your plate. Here's how each component fits into your workflow.
Understanding Sentio's Approach: Event-Driven Data Processing
Before diving into specific tools, it's helpful to understand how Sentio works. Raw blockchain data is like a fast-flowing river—there's a massive amount of information, but most of it isn't relevant to your specific project. Sentio helps you capture exactly the data you need and turn it into something you can actually use.
At the core of Sentio is the Processor—a TypeScript program you write that defines:
- What to watch: Which smart contracts or blockchain activities to monitor
- How to react: What to do when specific occurrences happen (like a swap, transfer, or state change)
- What to output: What to record for downstream data analysis
Sentio uses an event-driven architecture. Your code doesn't run constantly; instead, it "wakes up" when something interesting happens on-chain. When a transaction matches your criteria, Sentio automatically triggers your processing logic with the relevant data.
This approach is both fast and saves you a ton of work—you get a clear picture of what's happening in real-time without managing complex infrastructure.
1. Data Indexing Across Mainnet and Testnet
Before you can analyze anything, you need a steady stream of blockchain data. Sentio provides production-grade indexers for both Aptos Mainnet and Testnet.
This means you can develop and test on Testnet, then deploy to Mainnet using identical code. No infrastructure management, no scaling headaches, no data consistency issues.
Setting up data collection is straightforward:
import { AptosModulesProcessor, AptosNetwork } from "@sentio/sdk/aptos";

AptosModulesProcessor.bind({
  address: '0x123...abc', // Your module address
  network: AptosNetwork.MAINNET, // Or AptosNetwork.TESTNET
  startVersion: 1000000n
})
2. Flexible Analytics with the Sentio SDK
Now that you understand the event-driven approach, let's look at the several processor types available for Aptos. Each is built for different monitoring patterns:
AptosModulesProcessor - Binds to a specific Aptos module (smart contract) address. Use this to process events, function calls, and resource changes originating from or related to that module.
AptosGlobalProcessor - Network-wide analytics
Great for broader market analysis. Track daily active users across all DeFi protocols, monitor gas usage patterns, or analyze cross-protocol interactions.
AptosResourcesProcessor - State change tracking
This is your go-to for tracking account balances, NFT ownership changes, or any resource-based state that changes over time.
Type-Safe Development Experience
The SDK auto-generates TypeScript interfaces for any Aptos module you work with. You get full IDE support with auto-completion and compile-time type checking. We also include pre-built interfaces for core Aptos modules:
- Aptos Framework (0x1): Direct access to coin operations, including DepositEvent and WithdrawEvent
- Aptos Token (0x3): Legacy token standard support
- Aptos Digital Assets (0x4): Current token_object standard for NFT projects
Check out how simple it is to track an AddStateEvent for a validator:
import { AptosNetwork, AptosContext } from "@sentio/sdk/aptos";
import { stake } from "@sentio/sdk/aptos/builtin/0x1";
const START_VERSION="100000n";
const VALIDATOR_POOL_ADDRESS = "0x123...abc" // a validator address

stake.bind({
  network: AptosNetwork.MAIN_NET,
  startVersion: START_VERSION,
})
 // Track stake addition events
  .onEventAddStakeEvent(
 async (event: any, ctx: AptosContext) => {
 const eventData = event.data_decoded;
 if (eventData.pool_address === VALIDATOR_POOL_ADDRESS) {
 // Scale down stake amount to correct decimal places
 const amountAdded = eventData.amount_added.scaleDown(8);
        ctx.eventLogger.emit('add_stake', {amountAdded: amountAdded});
        ctx.meter.Counter('stake_pool').add(amountAdded, { validator: VALIDATOR_POOL_ADDRESS });
      }
    }
  )
Data Outputs: From Raw Data to Actionable Insights
Once your processor collects and transforms the data, Sentio provides several output formats to put it to work:
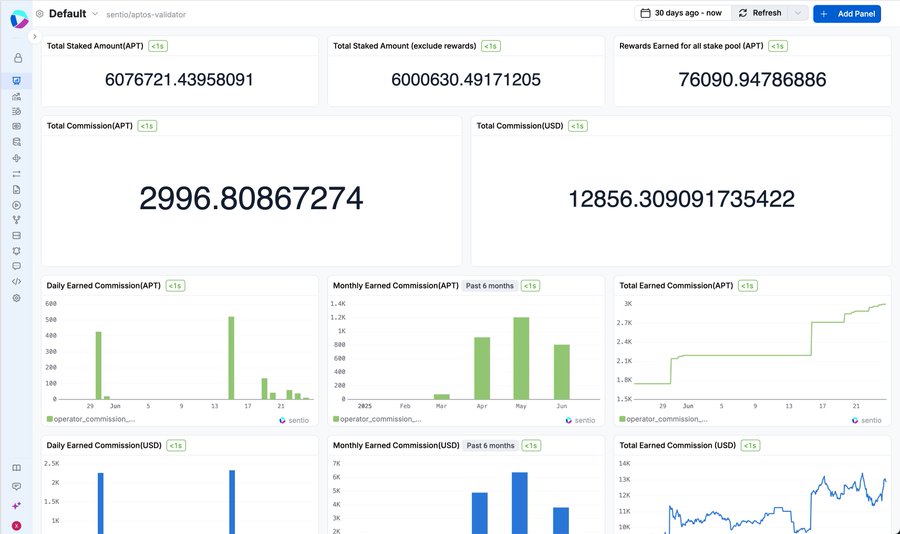
Metrics: Perfect for tracking numbers like trading volume, user count, or TVL. These power Sentio's built-in dashboards and alerting system.
Event Logs: Capture detailed activity records for user behavior analysis and debugging. Each event can include custom properties for rich analytics.
Entities: Store info on how different things are connected, like user profiles, token information, or protocol state. Ideal when you need to query relationships between different data points.
In the code example above, you can see both metrics (ctx.meter.Counter) and event logs (ctx.eventLogger.emit) in action. This processed data is something you can instantly access through Sentio's GraphQL API, SQL interface, and visualization tools.
3. Transaction Debugging and Optimization
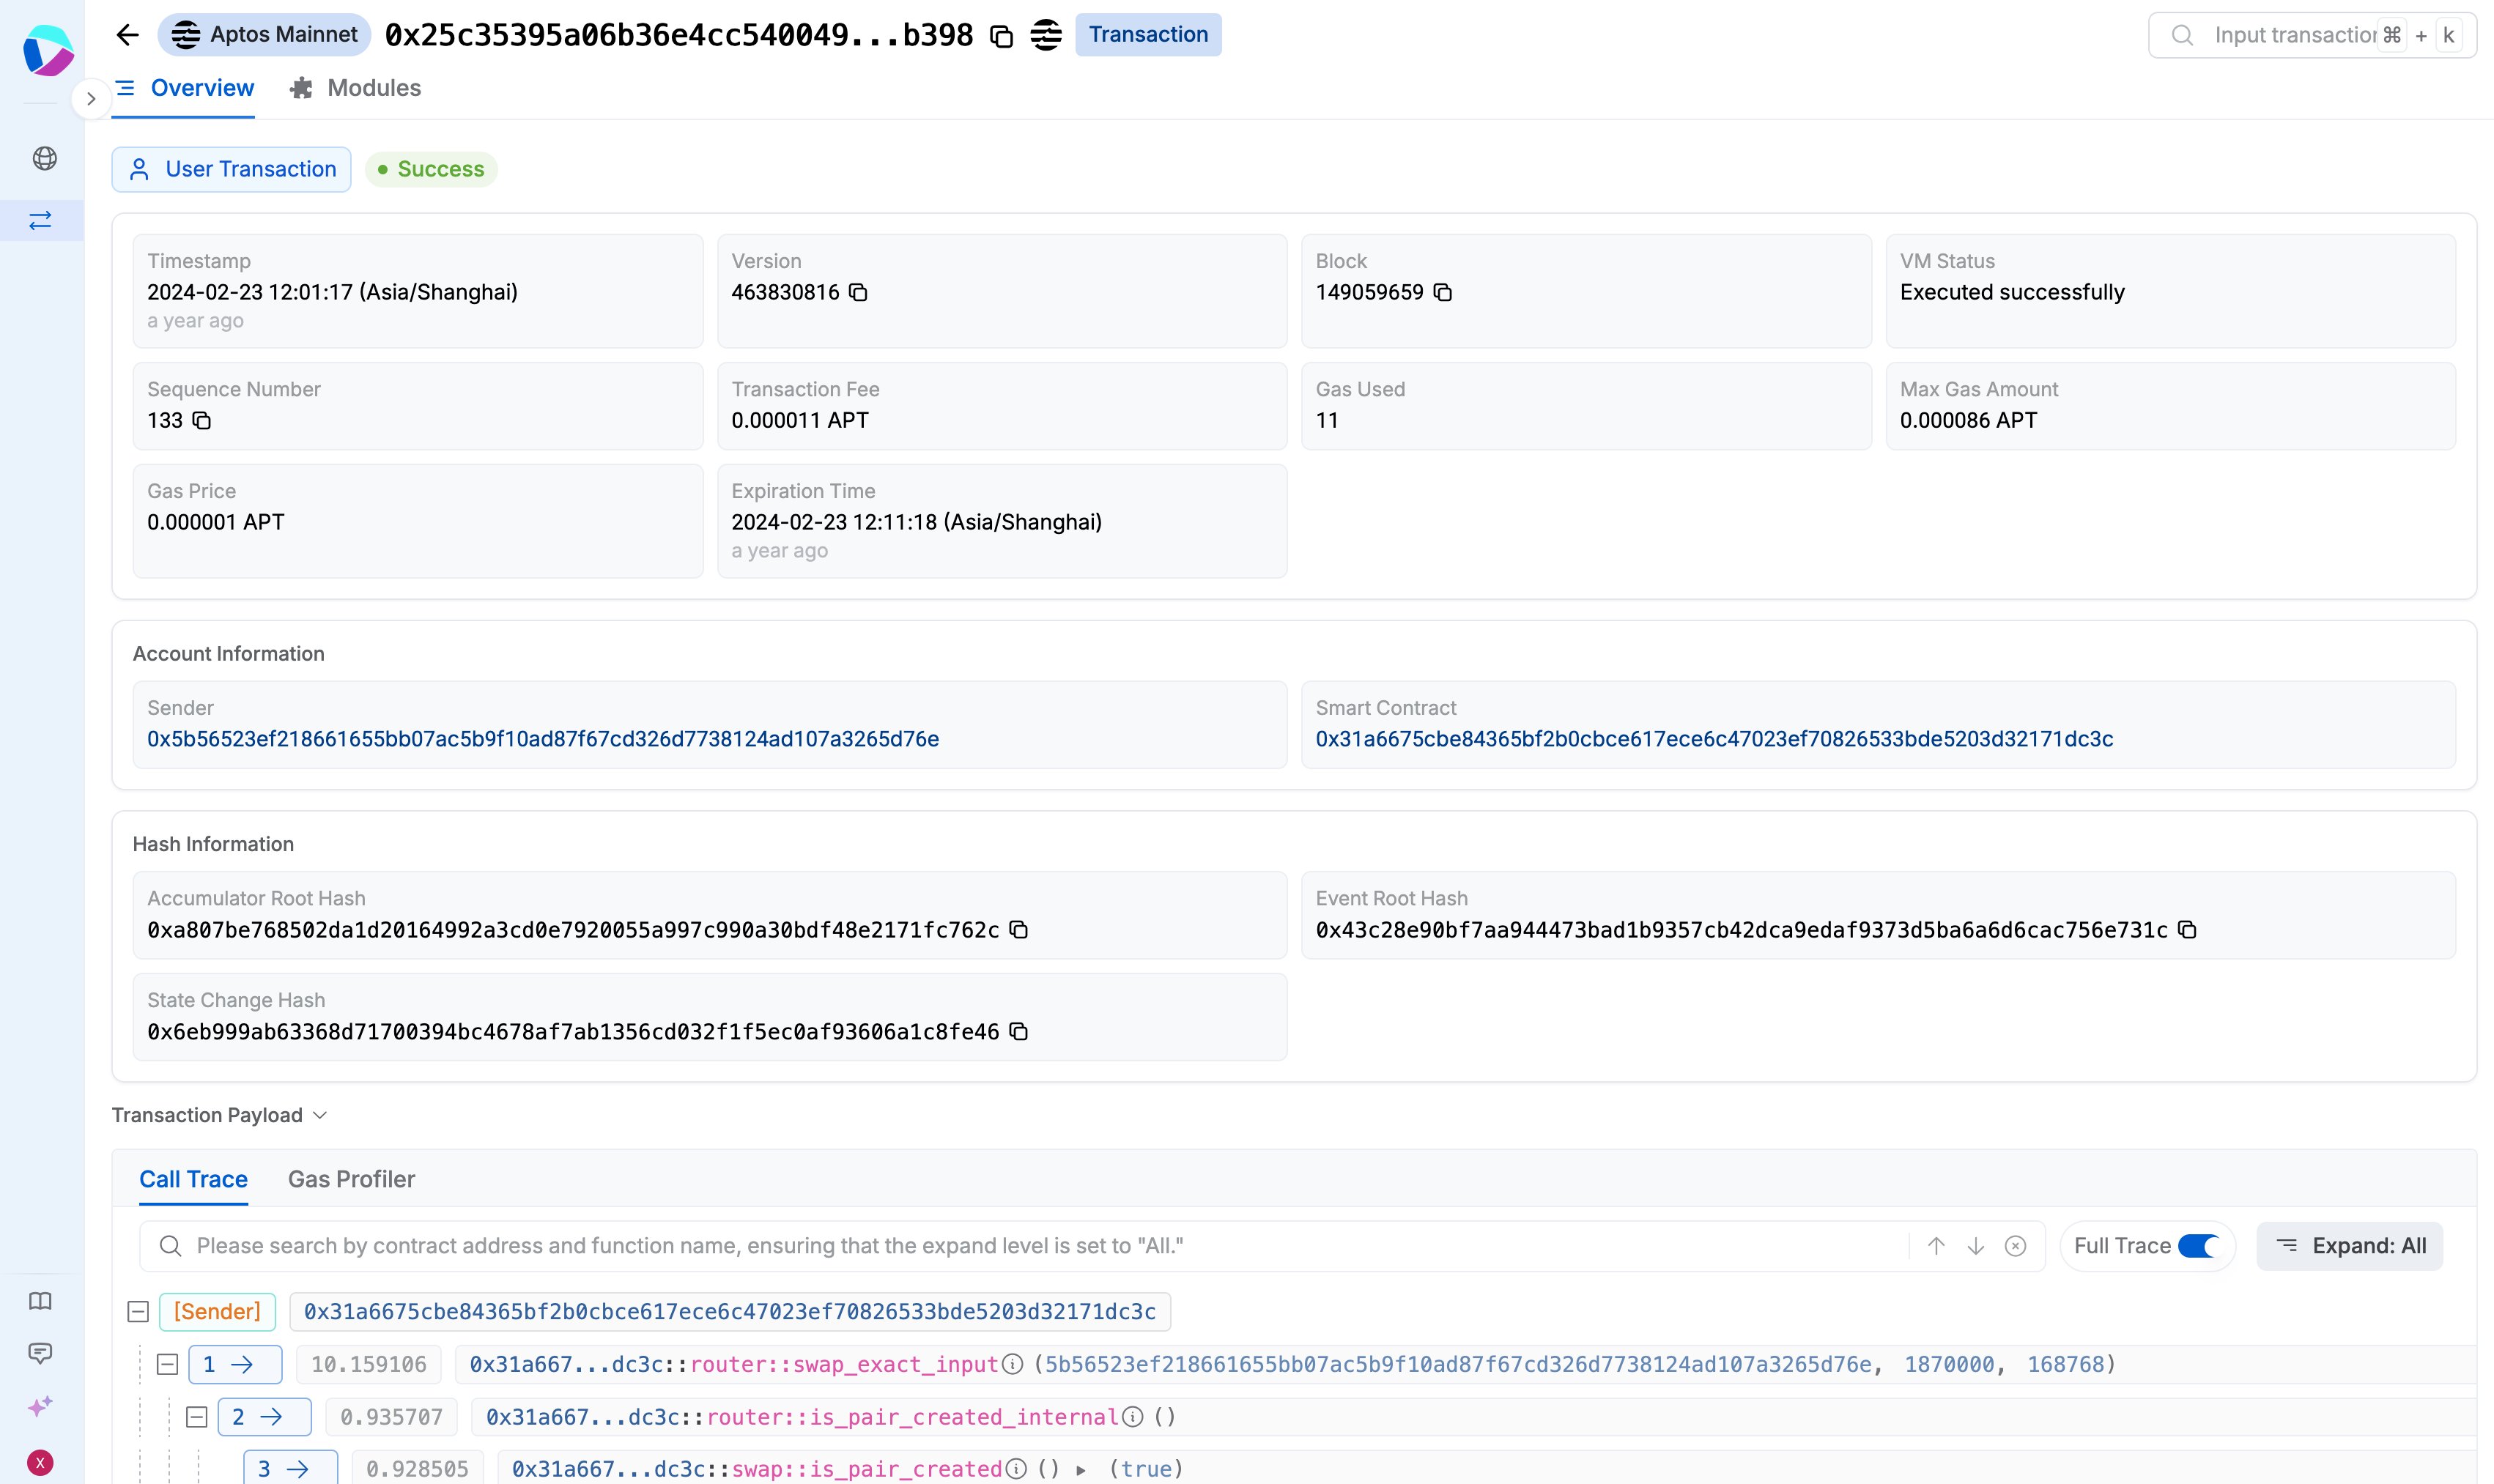
On-chain debugging is notoriously tricky. Unlike basic block explorers that only show the final outcome, the Sentio Transaction Debugger gives you a complete replay of the transaction's lifecycle with detailed execution traces.
 Here's what makes it so helpful:
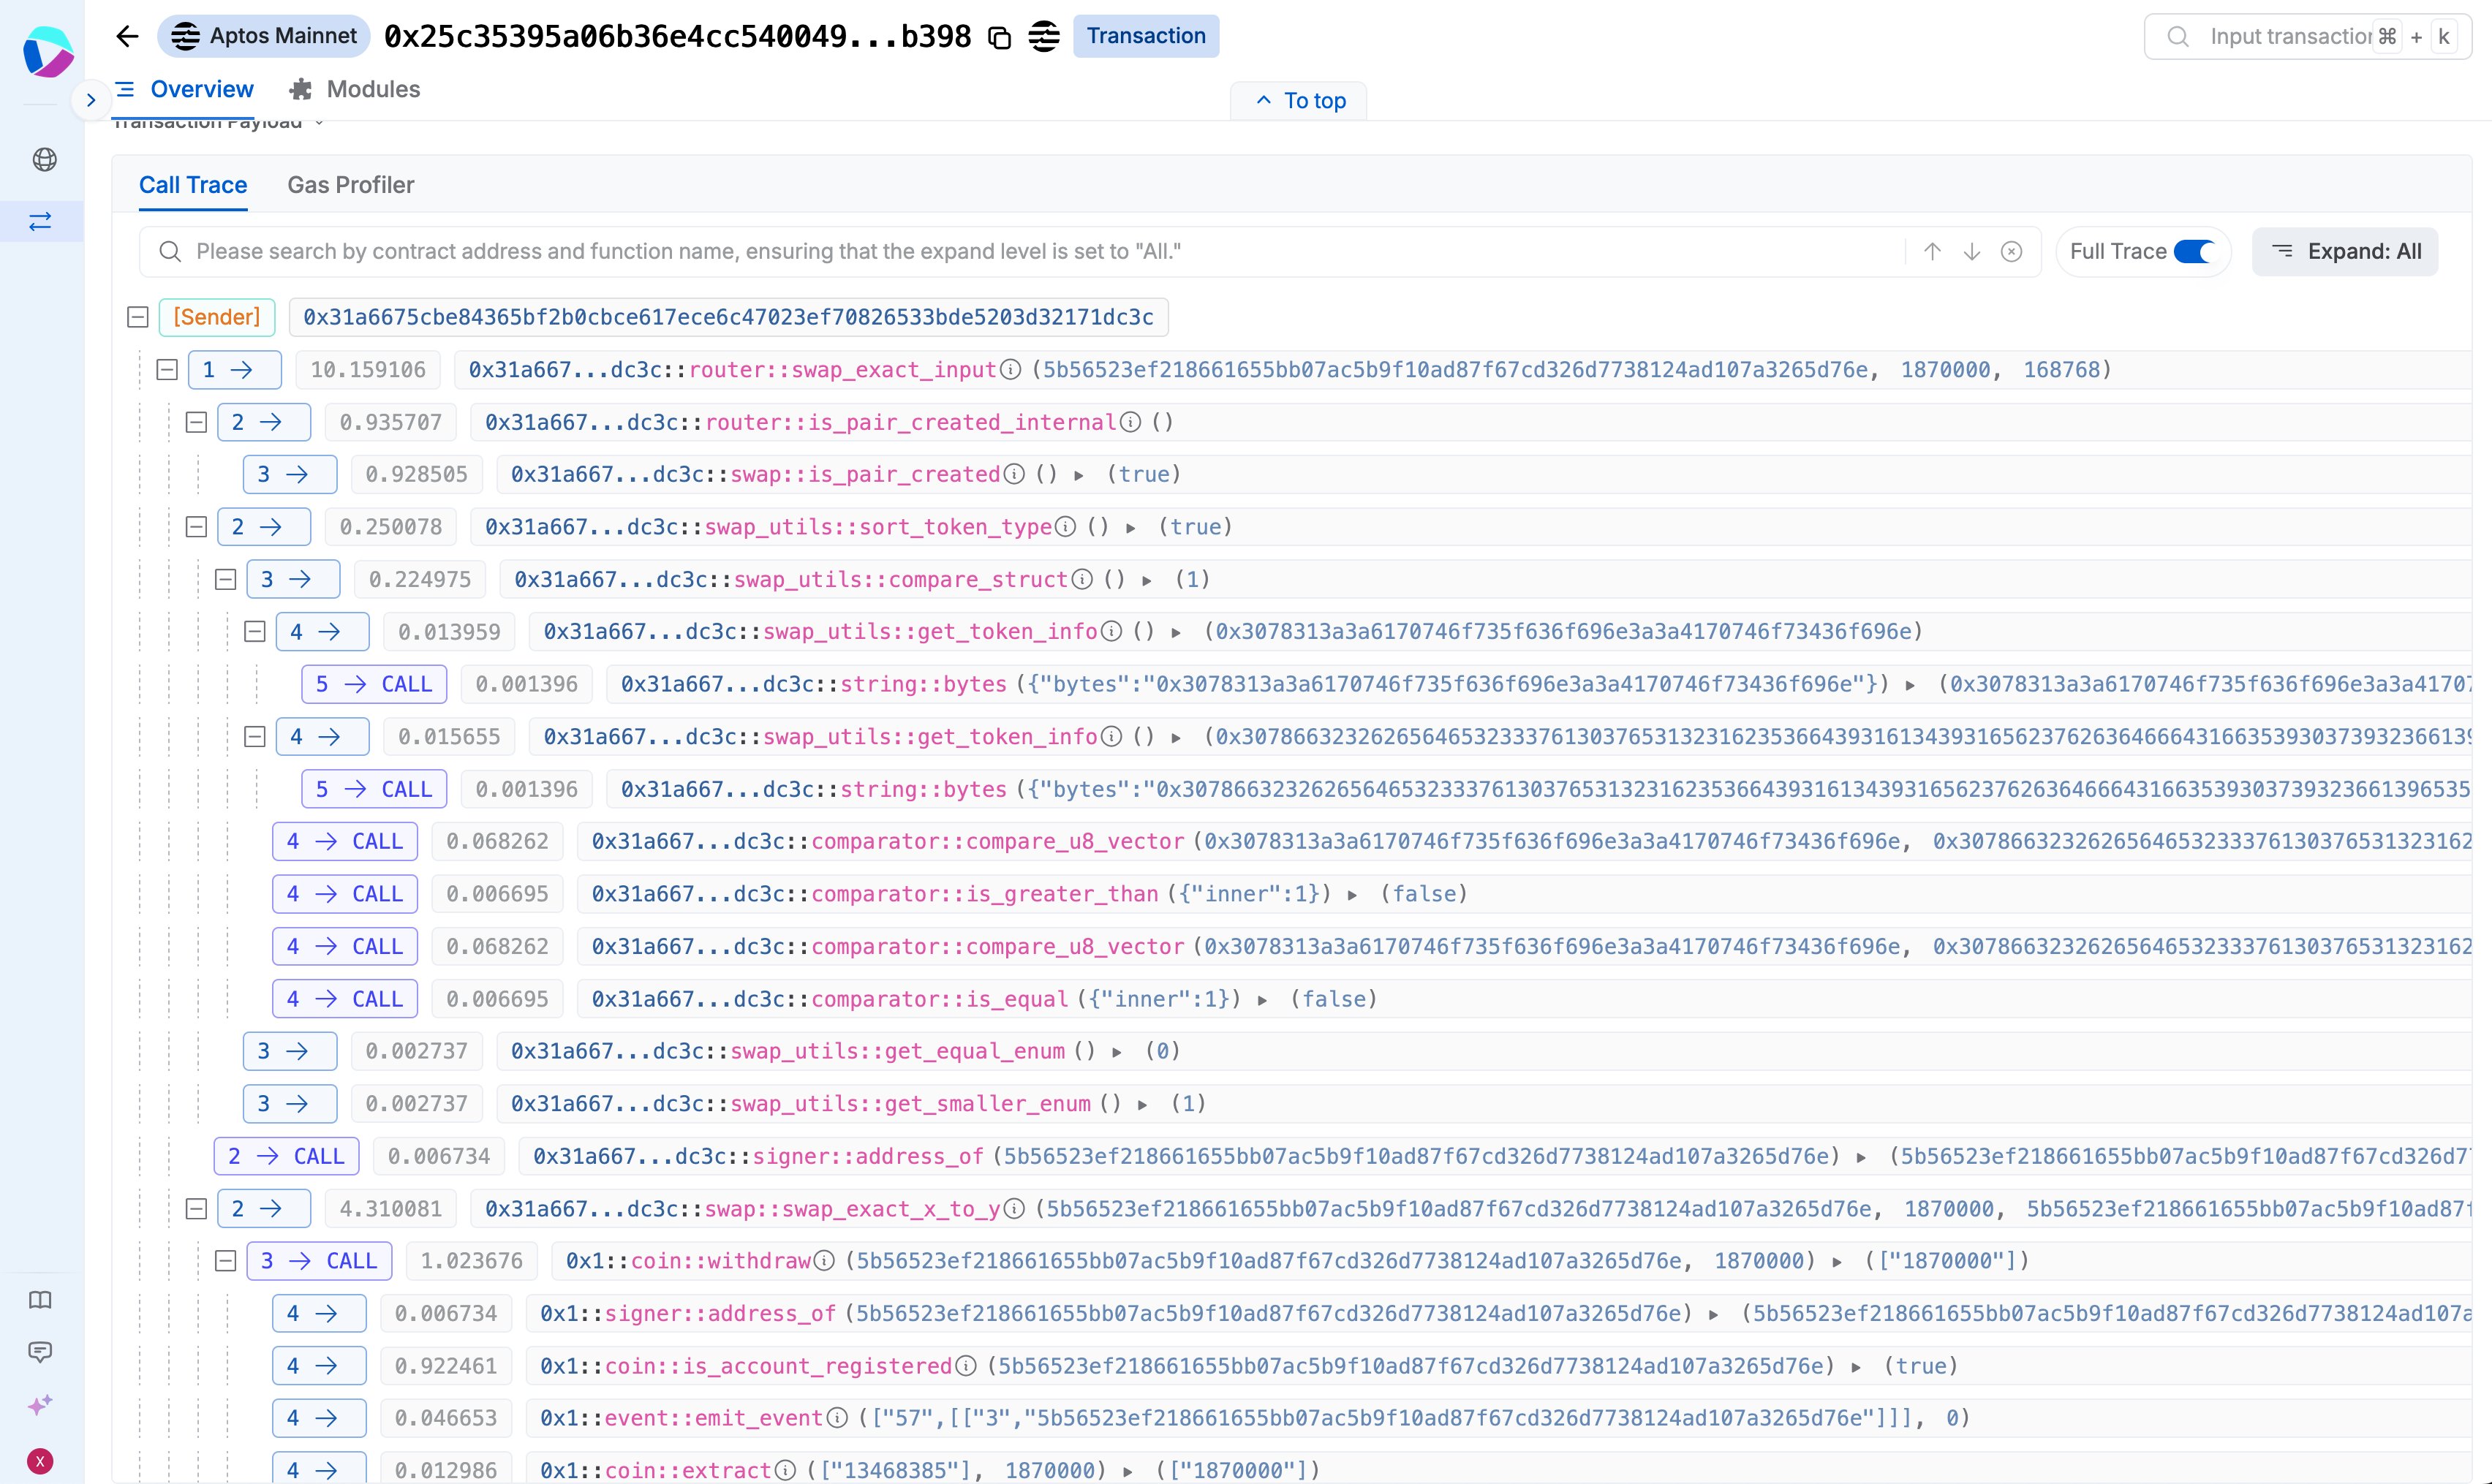
Complete Call Trace: See the full call stack including cross-module function calls. Track inputs and outputs for each function call to pinpoint exactly where issues occur.
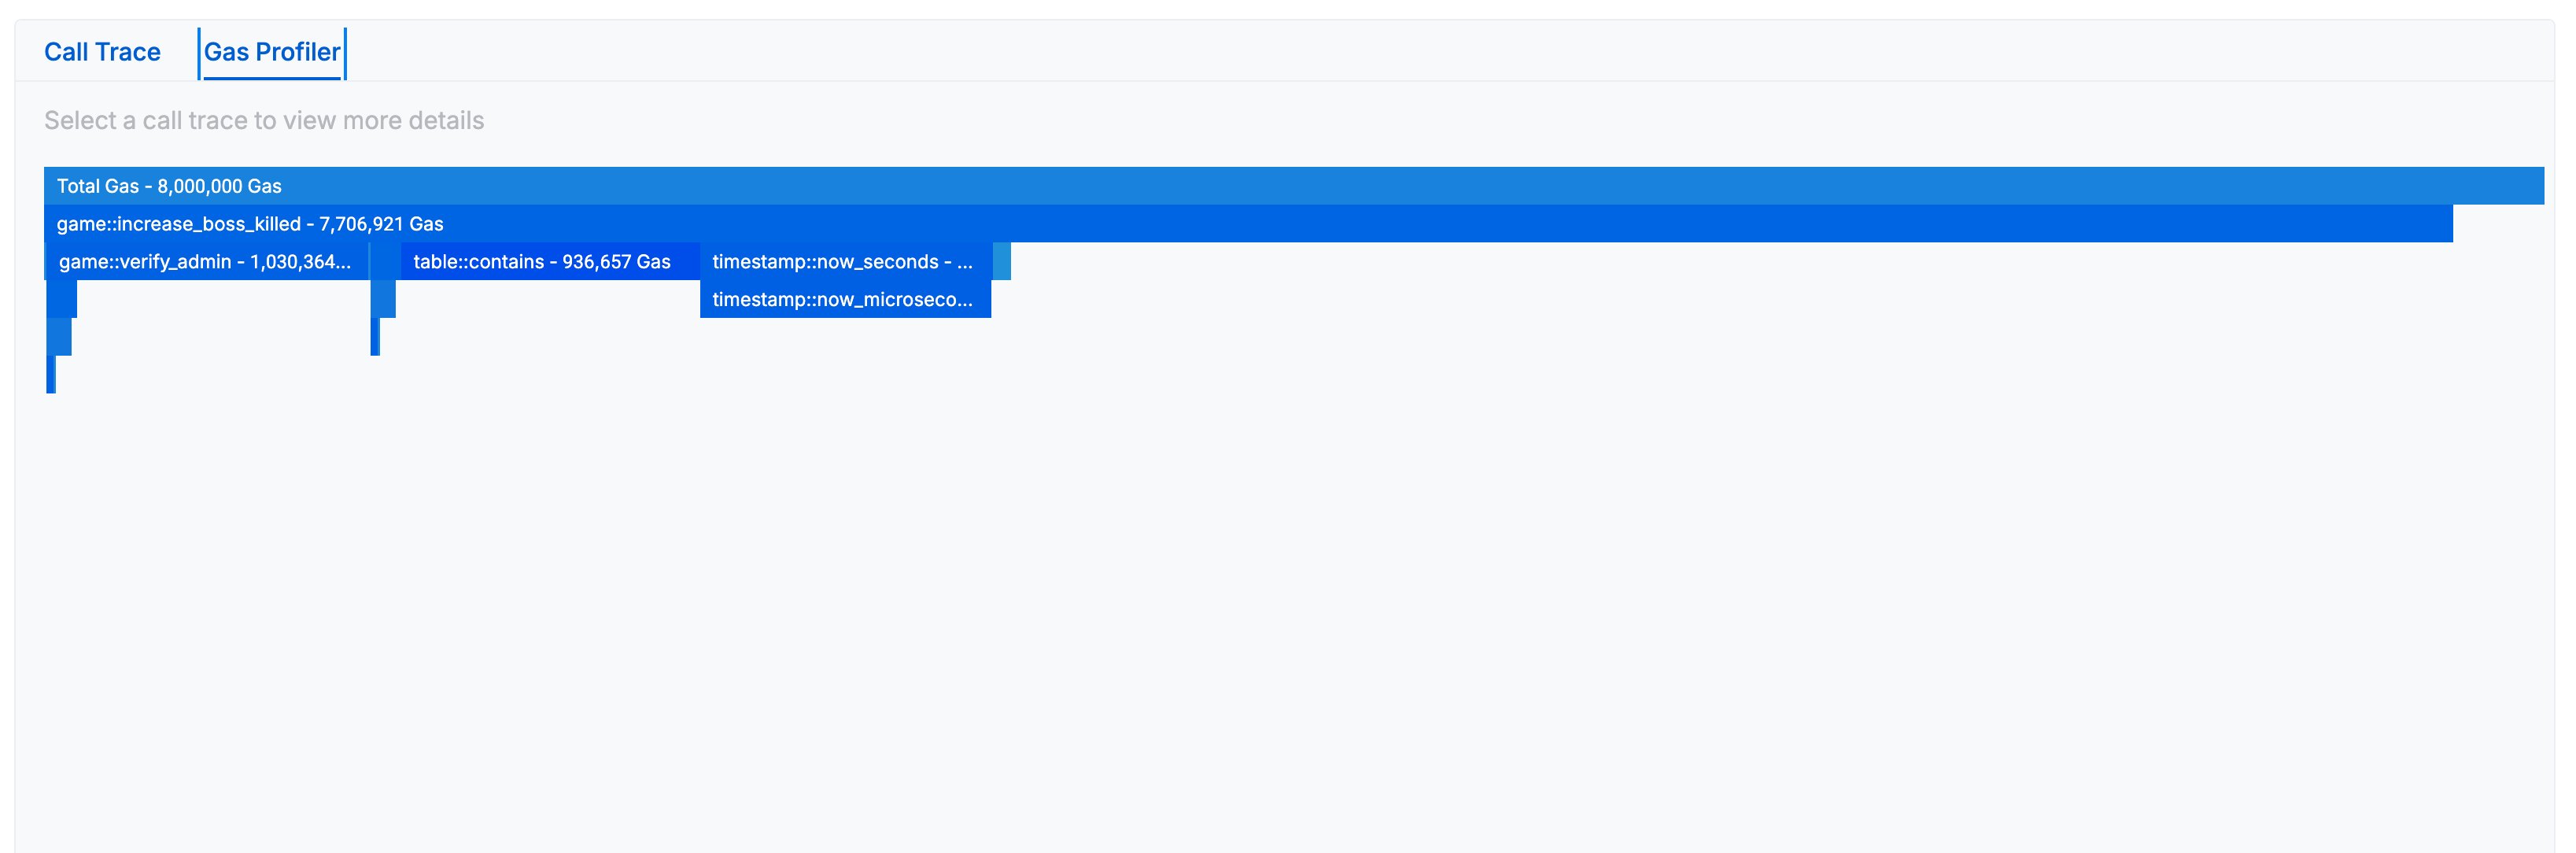
Gas Usage Analysis: The debugger shows resource consumption patterns and state changes, helping you identify performance bottlenecks. For example, if you notice a function consuming excessive resources, you can dive into its execution trace to see which specific operations are expensive, then optimize your Move code accordingly.
This turns debugging from a guessing game into a clear, step-by-step process. Instead of wondering why a transaction failed, you can see the exact function call that reverted and understand why.
4. Archive RPC Nodes On-Demand
Sometimes you just need direct blockchain access with full historical data. Public RPC endpoints typically only store recent data, and running your own archive node is complex and expensive. Sentio provides dedicated RPC endpoints for Aptos Mainnet and Testnet with complete historical data access. Create them in minutes, not days. Each node includes built-in monitoring:
- Request volume and error rate tracking
- Performance metrics and response time analysis
- Cost monitoring with transparent pay-per-request billing
Learn by Example: Tutorial Video
We've created a comprehensive tutorial that walks through building your first Aptos monitoring project on Sentio from setup to deployment.
Sentio 102: Setup Realtime Monitoring For Your dApps on Aptos(New)
Get Started
Ready to build? Here's how to begin:
- Start building - Create your free account and deploy your first processor
- Read the docs - Detailed guides and examples
- Join our Community - Connect with our team and other developers
The Aptos ecosystem is evolving rapidly. With the right infrastructure foundation, you can focus on building great products instead of solving infrastructure problems.